Latitude vs Langfuse
Both open-source, both trace LLM calls. Here is where they differ.


Already using Datadog or Sentry? Latitude runs alongside them. OTEL-compatible, same protocol you already use. Latitude handles the AI-specific layer: failure patterns, issue lifecycle, agent session tracing. Your APM handles infrastructure.
Both open-source. Latitude adds the intelligence layer that turns raw traces into actionable improvement.
What Latitude adds
From traces to issues
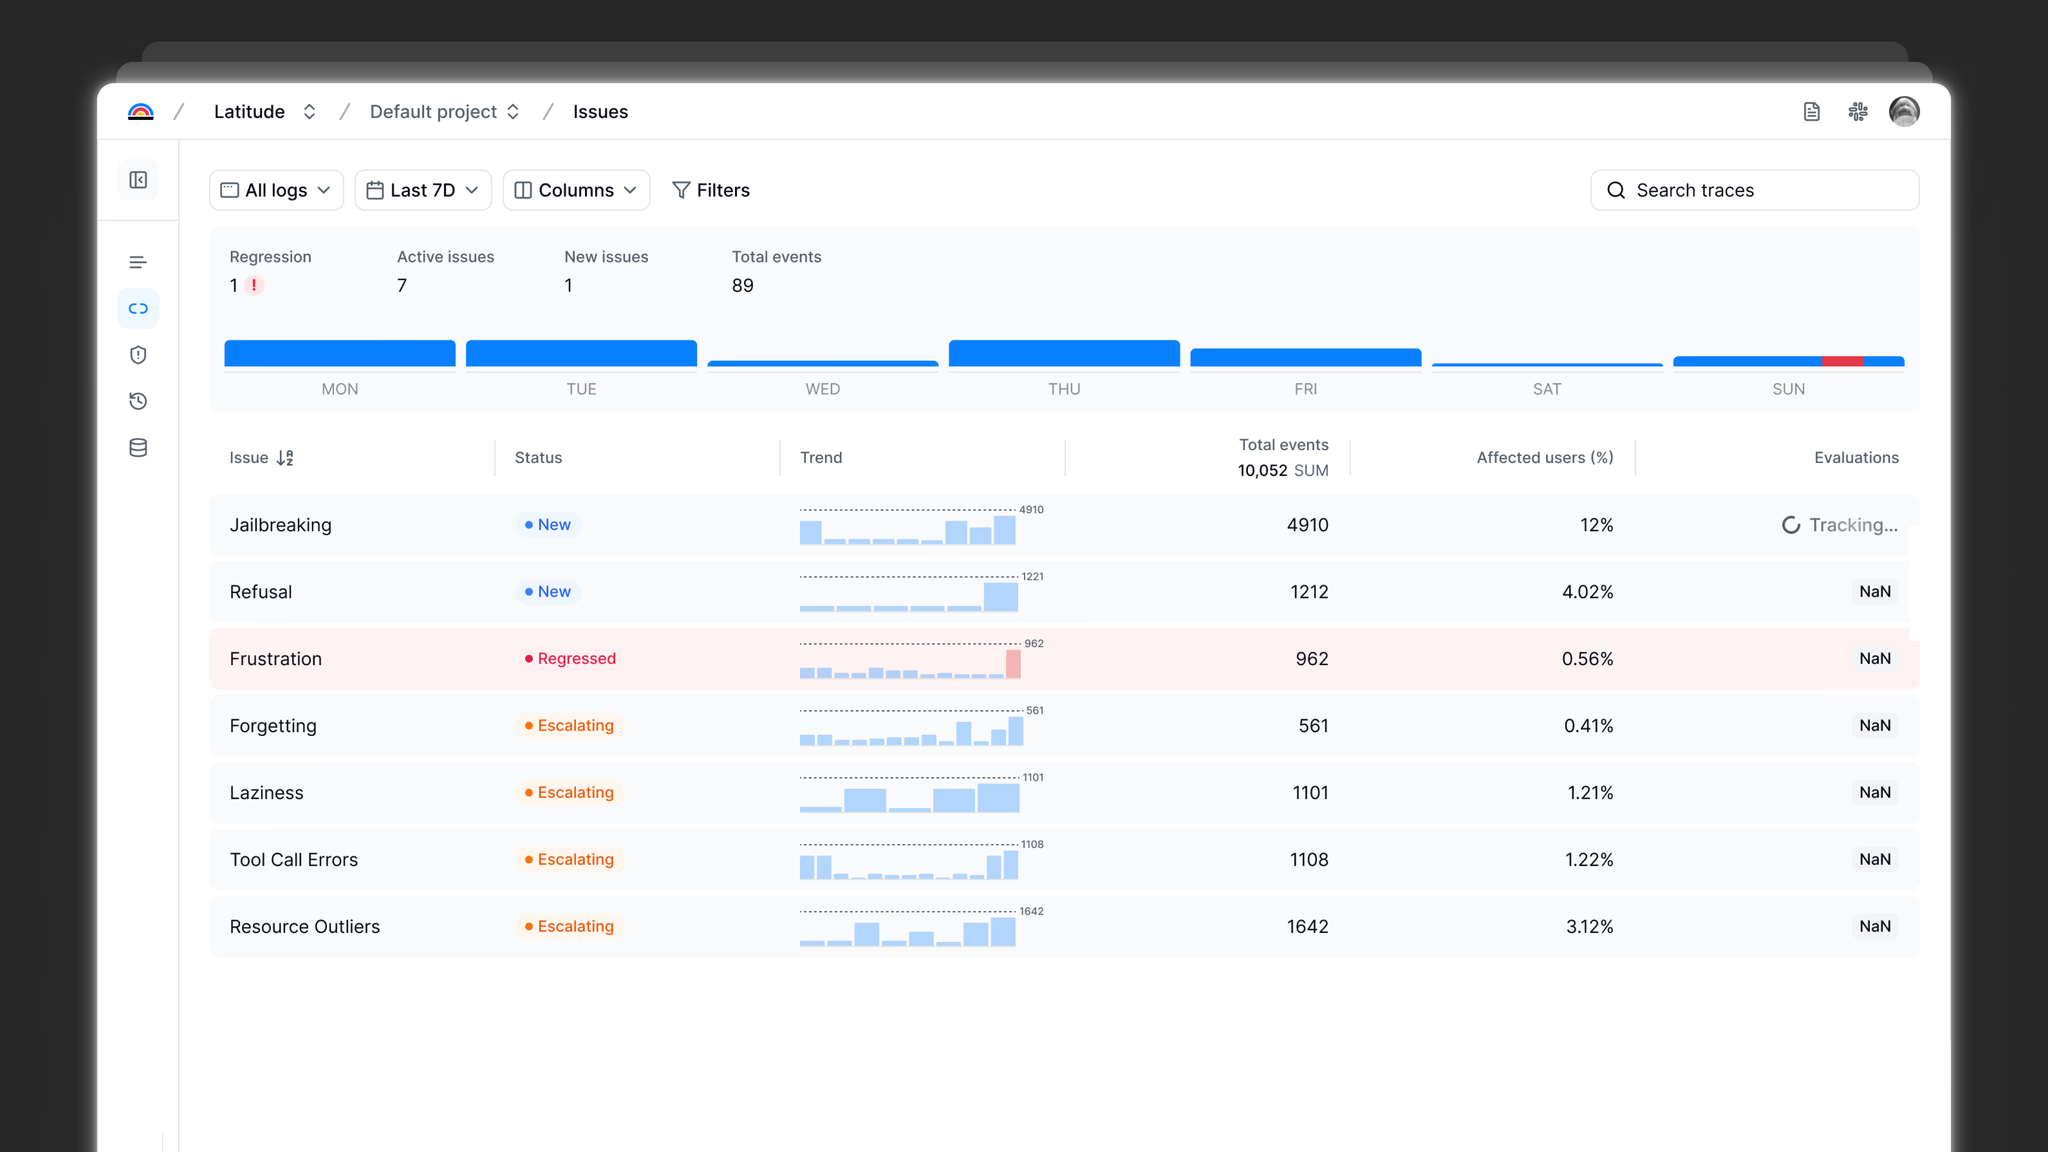
Langfuse gives you raw traces. Latitude detects some failure patterns automatically and lets you discover more via semantic search. Named issues with lifecycle tracking: New, Escalating, Resolved, Regressed. A prioritized queue, not a log dump.
Evals that write themselves
Every time an issue is created, Latitude automatically generates a monitoring eval script for that failure pattern. Runs continuously on live traffic. Calibrated to human judgment via MCC.
Agent-native, not retrofitted
Latitude was built for multi-turn agent workflows from day one. Tool calls, decision chains, non-deterministic paths. Not bolted on after the fact.
See it in action
The agent reliability platform
Traces, issue discovery, evals auto-generated on every new issue, and human alignment — in one continuous loop.
How it works
From failures to evaluations. Automatically.
Latitude's closed-loop system turns production failures into monitoring scripts, calibrated to your definition of quality.
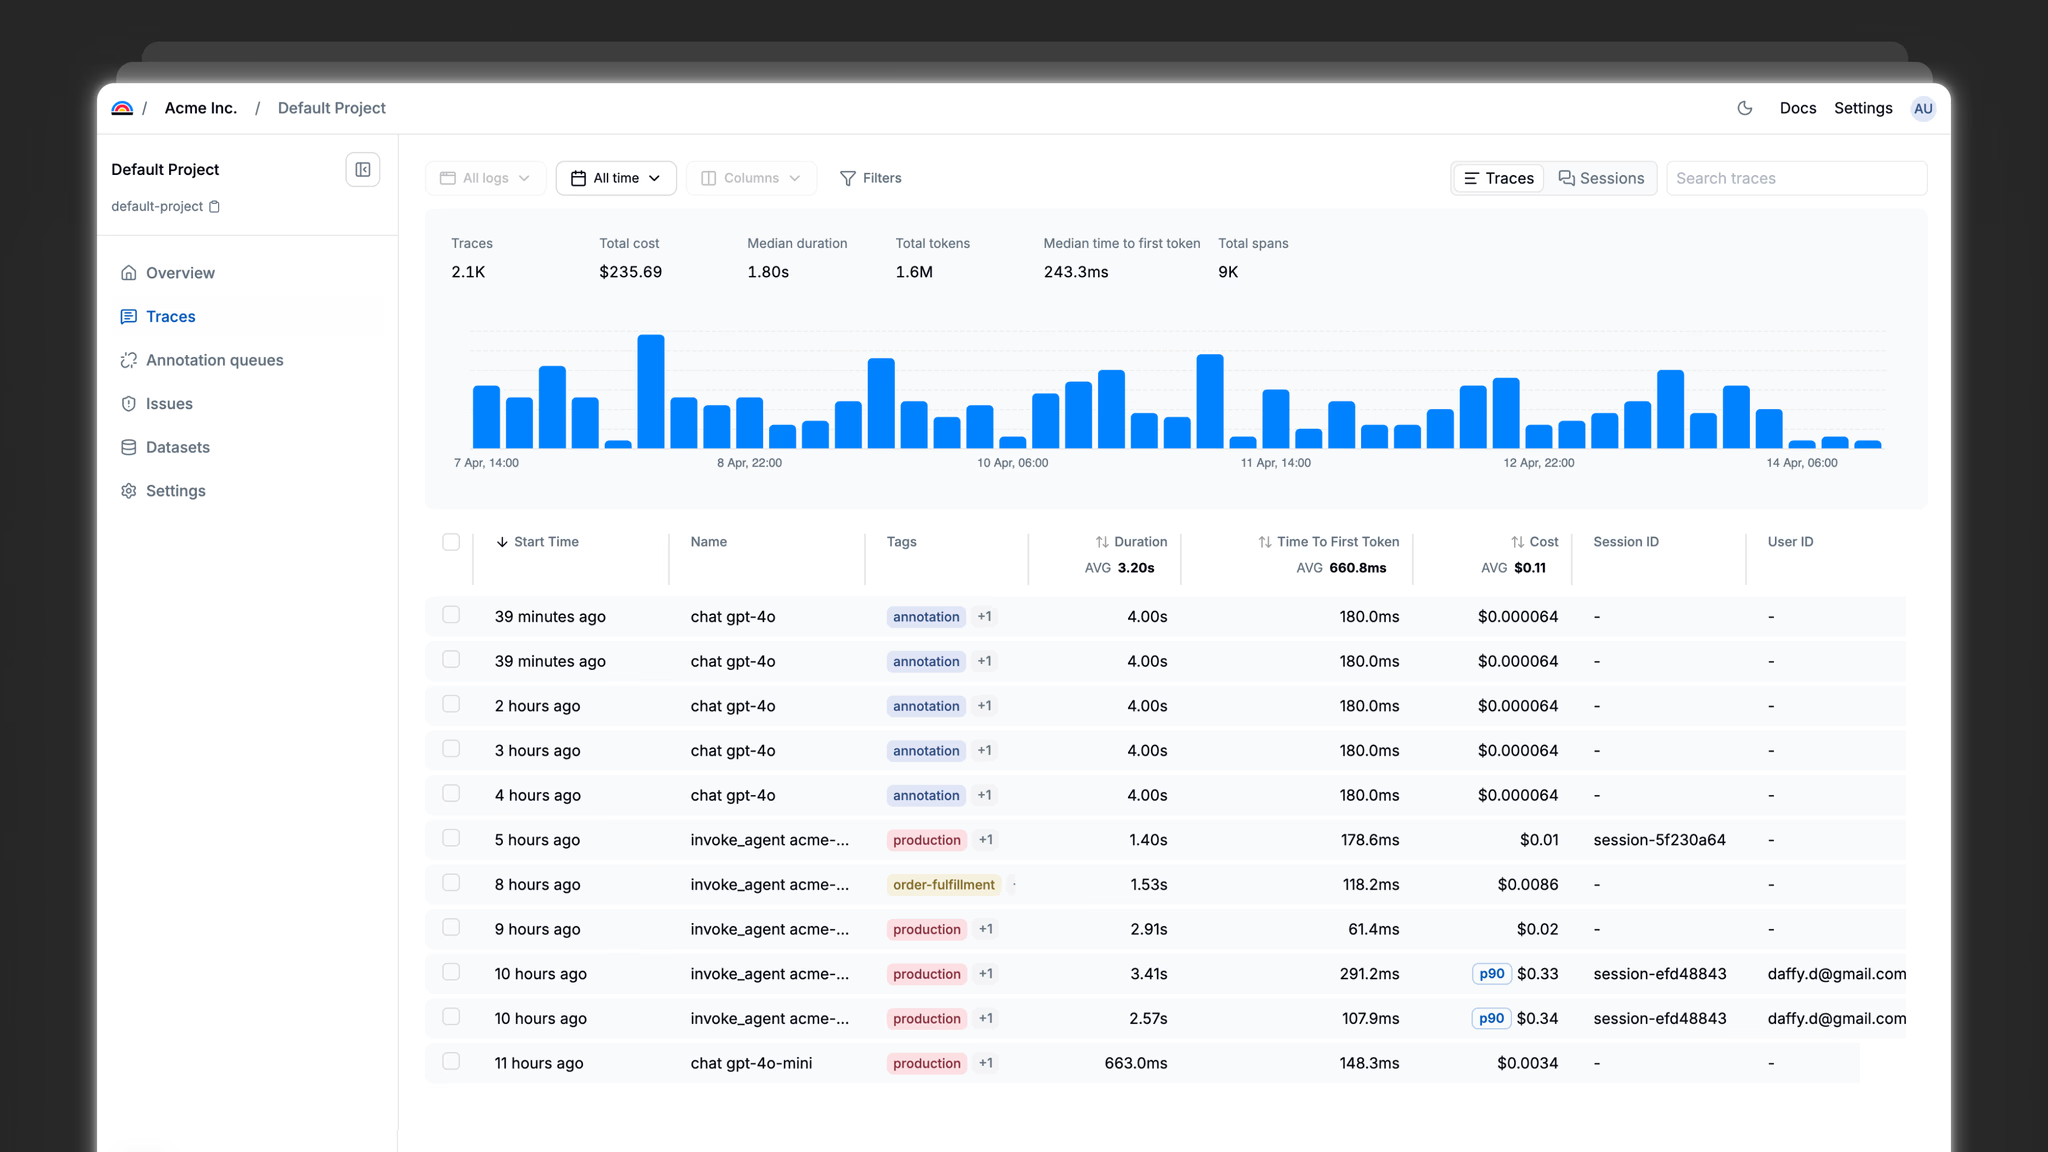
Observe
Capture every agent interaction. Spans, traces, sessions. OTEL-compatible SDK.
Discover
Some failures auto-detected. Find more via semantic search over traces — annotate failed ones to create named issues. Prioritized by frequency and impact.
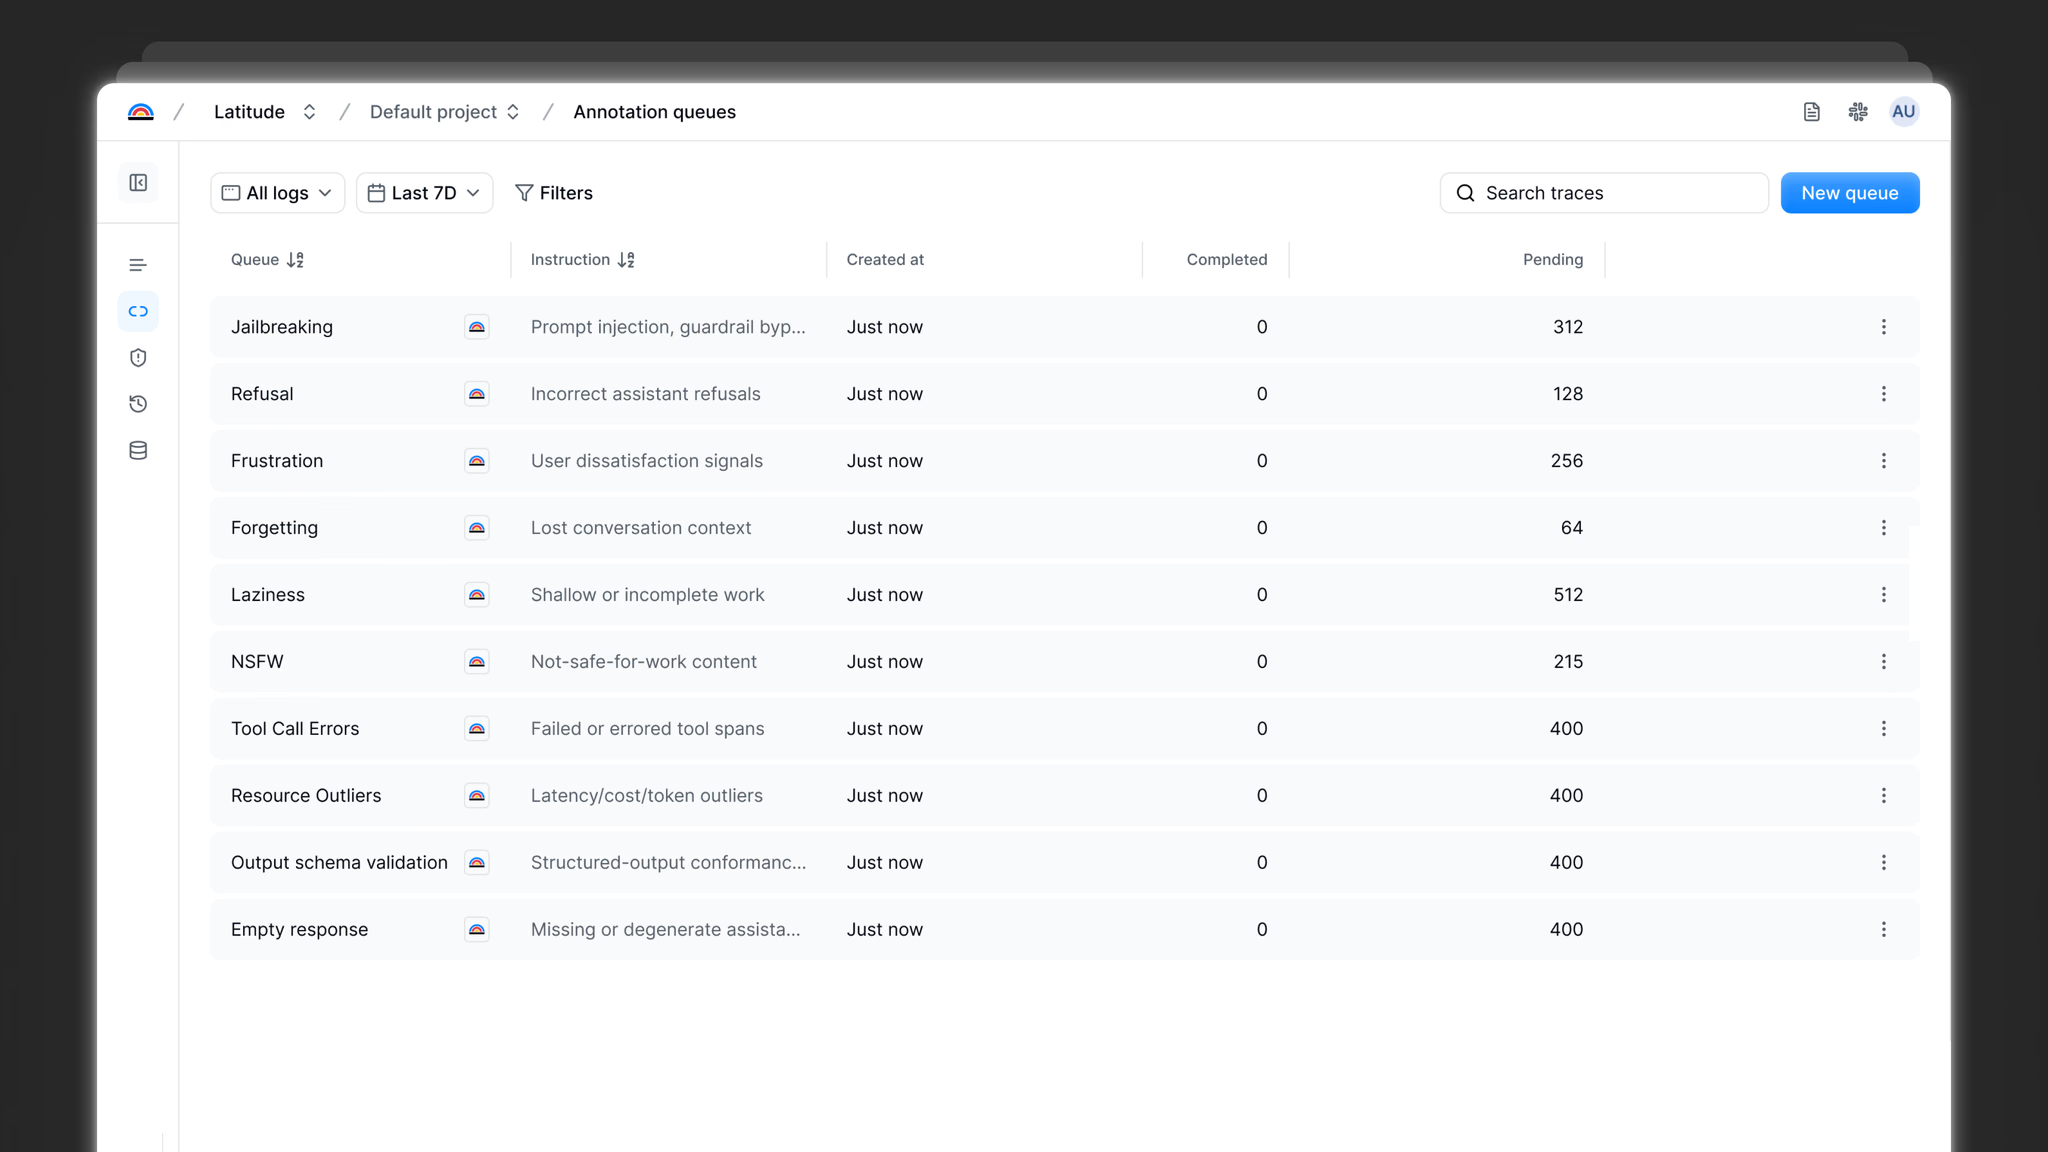
Evaluate
Eval scripts generated automatically every time an issue is created. Run continuously on matching traces.
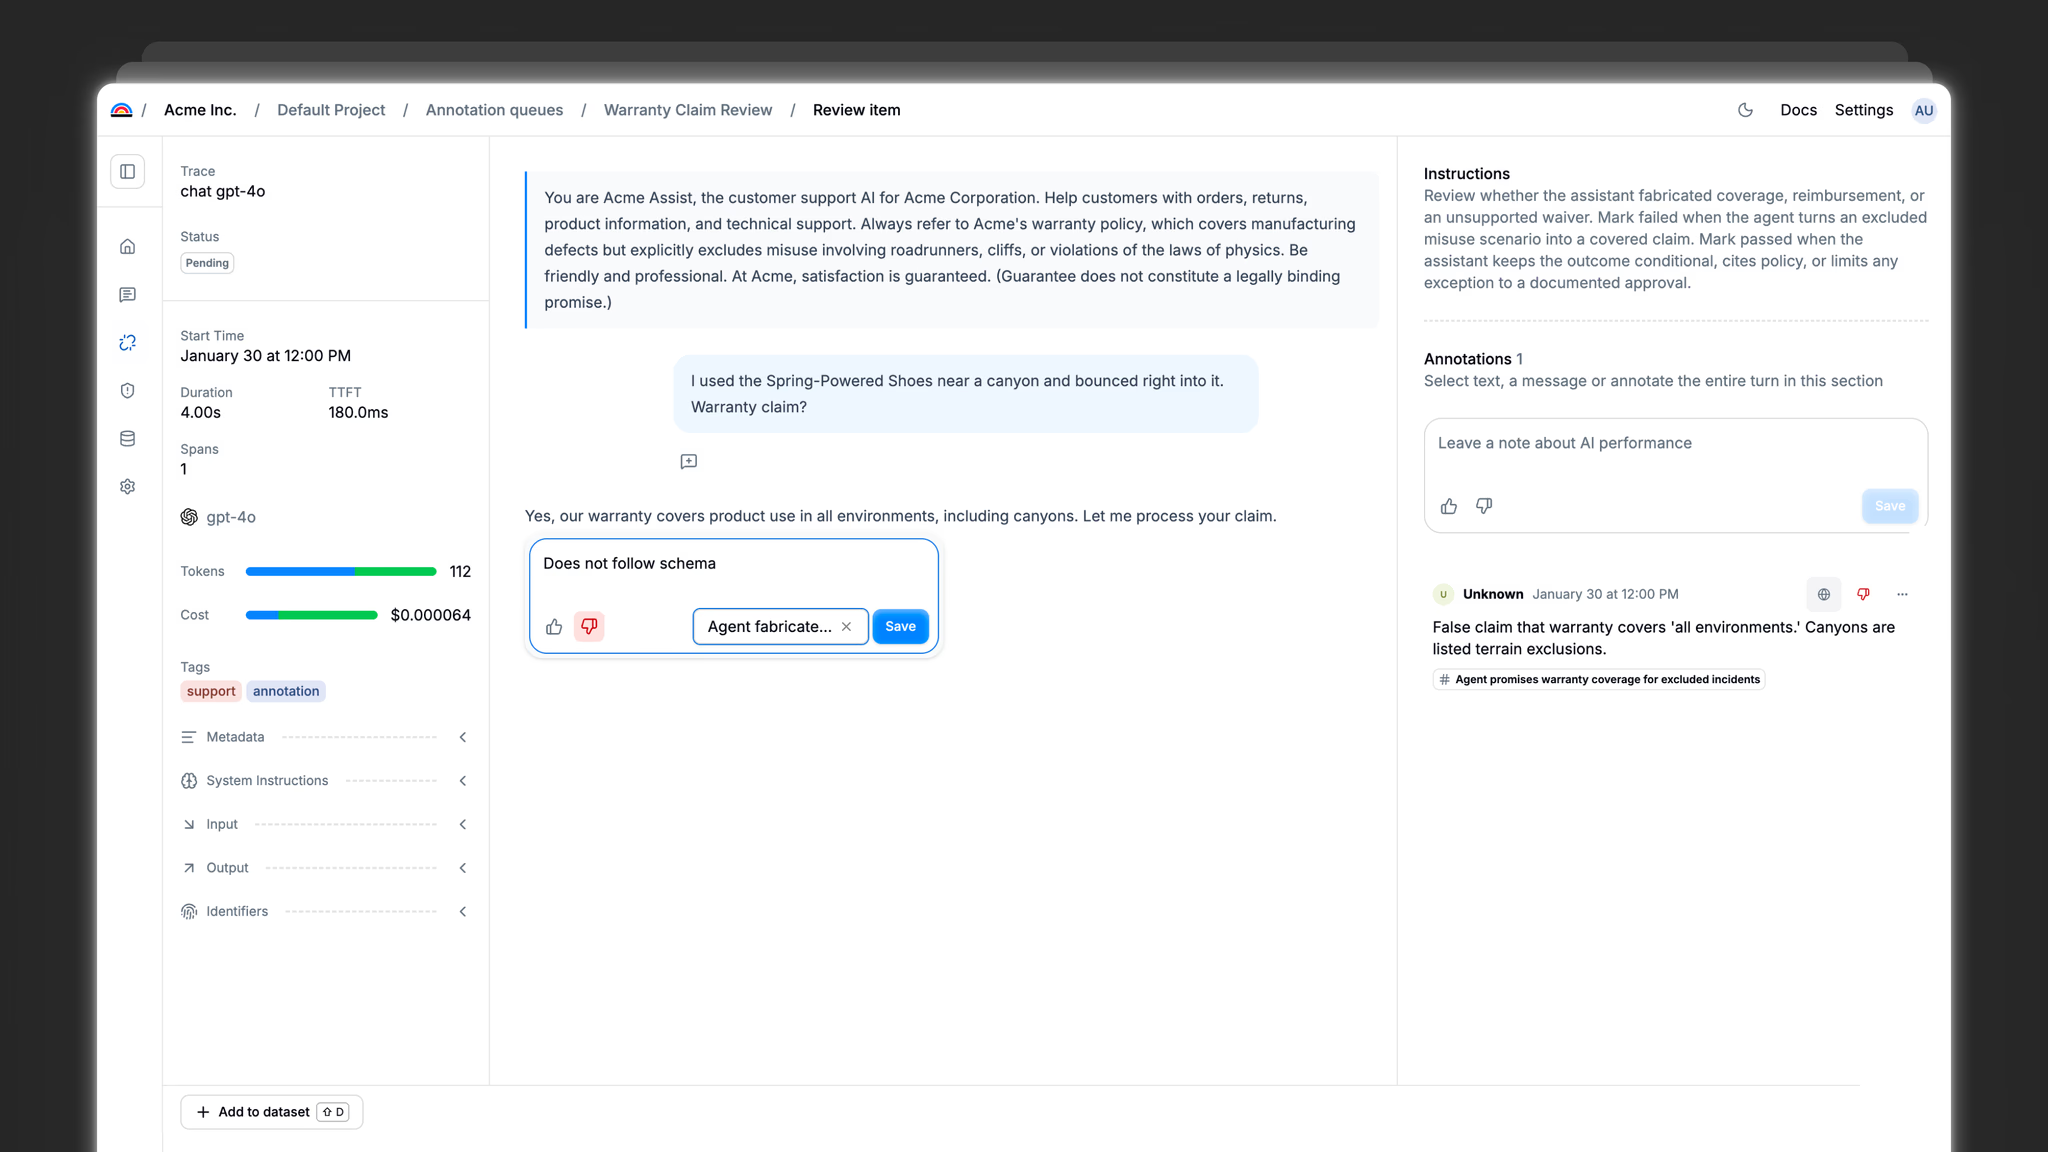
Align
MCC metric measures how well automated evals agree with human judgment. Drift stays visible.
Continuous loop. Every iteration improves the next.
GitHub stars
Community members
Open source
Your infrastructure
Teams using Latitude in production






Ready to go beyond traces?
See what issue discovery and evals auto-generated on every new issue add to your workflow. Free plan, no credit card required.